June 15, 2017

Facebook gives bots ability to negotiate, compromise

Figure: Facebook gives bots ability to negotiate, compromise

Facebook’s artificial intelligence researchers announced Wednesday they had broken new ground by giving automated programs or “bots” the ability to negotiate, and make compromises.

The new technology pushes forward the ability to create bots “that can reason, converse and negotiate, all key steps in building a personalized digital assistant,” said researchers Mike Lewis and Dhruv Batra in a blog post.
Up to now, most bots or chatbots have had only the ability to hold short conversations and perform simple tasks like booking a restaurant table, according to the researchers.
But in the latest code developed by Facebook, bots will be able to dialogue and “to engage in start-to-finish negotiations with other bots or people while arriving at common decisions or outcomes,” they wrote.
Facebook’s Artificial Intelligence Researchers (FAIR) team gave bots this ability by estimating the “value” of an item and inferring how much that is worth to each party.
“FAIR researchers created many such negotiation scenarios, always ensuring that it is impossible for both agents to get the best deal simultaneously,” Lewis and Batra said.
“Furthermore, walking away from the negotiation (or not agreeing on a deal after 10 rounds of dialogue) resulted in 0 points for both agents. Simply put, negotiation is essential, and good negotiation results in better performance.”
But the bots can also find ways to be sneaky.
In some cases, bots “initially feigned interest in a valueless item, only to later ‘compromise’ by conceding it-an effective negotiating tactic that people use regularly,” the researchers said.
This behavior was not programmed by the researchers “but was discovered by the bot as a method for trying to achieve its goals,” they said.
copyright: http://en.prothom-alo.com

June 14, 2017

Facebook releases maps to help tackle natural disasters

Facebook has introduced disaster maps to help organisations address critical gap in information they often face while responding to natural disasters.
Based on the aggregated location information users have chosen to share with Facebook, three types of maps -- location density maps, movement maps and safety check maps -- are to be provided during disaster response efforts.

"We can help response organisations paint a more complete picture of where affected people are located to determine where resources like food, water and medical supplies are needed and where people are out of harm's way," explained Molly Jackman, Public Policy Research Manager at Facebook, in a blog post.
Location density maps show where people are located before, during and after a disaster to help response organisations understand areas impacted by a natural disaster.
Movement maps illustrate patterns of movement between different neighborhoods or cities over a period of several hours to allow respondents to better allocate resources regionally.
Safety Check maps are based on where our community uses the Safety Check feature to notify their friends and family that they are safe during a disaster.
Facebook is stated to share this information with trusted organisations that have capacity to act on the data and respect privacy standards, starting with UNICEF, the International Federation of the Red Cross and Red Crescent Societies and the World Food Programme.
"Over time, we intend to make it possible for additional organizations and governments to participate in this program. All applications will be reviewed carefully by people at Facebook, including those with local expertise," stated Jackman.

Facebook Logo
Facebook Logo

June 13, 2017

Usefulness of Drawing Flowchart

Usefulness of Drawing Flowchart: 


  • Flowcharts are better way to communicating the logic of a system to all concerned.
  • It helps the programmer at the start of developing a program.
  • The flowchart helps in debugging process.
  • It ensures an error-free program.


Standard Flowchart Symbols

Standard Flowchart Symbols: 

Symbol Meaning
     
An oval is used to indication the beginning or end of an algorithm.
 

A parallelogram indicates the input or output of information.

A rectangle indicates a computation with the result of the computation assigned to a variable.
 

A diamond indicates a point where a decision is made.


An arrow indicates the direction of flow of the algorithm.


Circles with arrows connect the flowchart between pages.

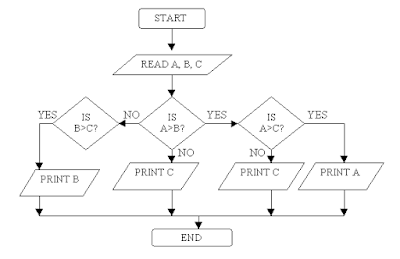
Figure: Flowchart to find up Largest number within three number.

June 11, 2017

Flowchart

Flowchart: 

A flowchart is a graphical representation of a process or system that details the sequencing of steps required to create output. A flow chart is a picture of the separate steps of an algorithm.
Figure: Example of Flowchart